tishaa14
Bangladesh

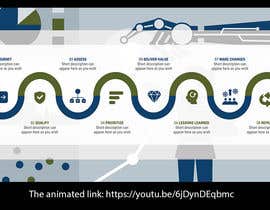
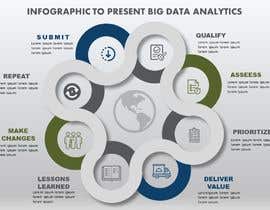
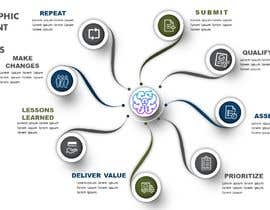
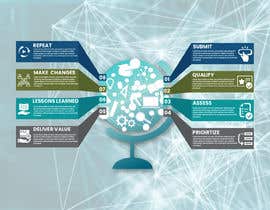
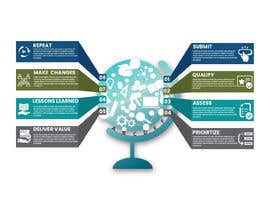
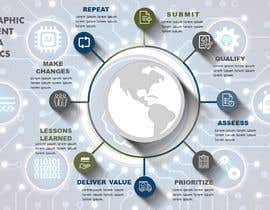
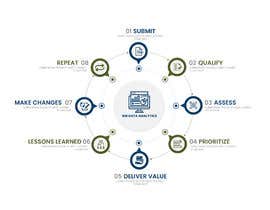
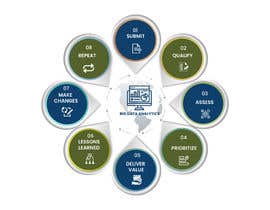
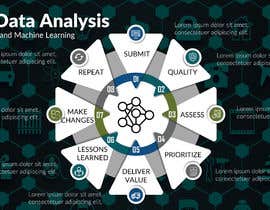
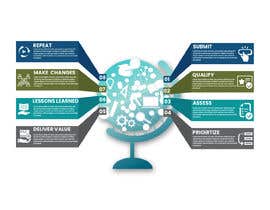
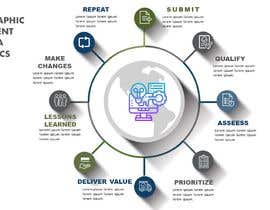
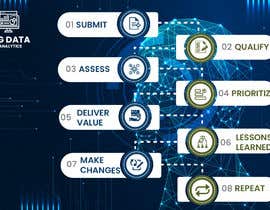
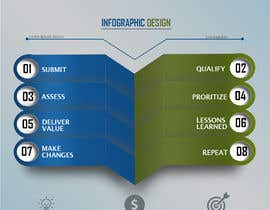
I need an editable info graphic (Could be power point, or anything else) that represents A data AND big data analytics demand process. Should have some sort of analytics machine learning, internet of things (Smart devices and artificial intelligence ) theme on it. SHOULD be SIMPLE yet IMPACTFUL: Steps are:
1. Submit (minor description)
2. Qualify (minor description)
3. Assess (minor description)
4. Prioritize (minor description)
5. Deliver Value (minor description) - would be need if this has a speed and agility theme
6. Lessons Learned (minor description)
7. Make Changes (minor description) _ this needs to point to a visual of a central team with build as you go concept)
8. Repeat (minor description)
It would be great to have 4 versions of this:
1. one with description included
2. one with no description included
3. One animated
4. One Non-Animated
RGB Colors we would like to use are:
Dark BLUE: 14, 64, 106
Dark GREEN: 85, 98, 43
Charcoal: 85, 87 89
Need in editable powerpoint, and need in PHP, PSD, AI, GIF, JPEG formats also
“Thank you Julius! Excellent work”
![]() samiadg, Canada.
samiadg, Canada.


Đăng cuộc thi của bạn Nhanh chóng và dễ dàng

Nhận được vô số Bài dự thi Từ khắp nơi trên thế giới

Trao giải cho bài thi xuất sắc nhất Download File - Đơn giản!